

1. Introduction
2. Materials and methods
2.1 Experimental fish
2.2 External morphometric trait analysis
2.3 Sectioned morphometric trait analysis
2.4 Statistical analysis
3. Results
3.1 Growth and survival
3.2 External morphometric traits
3.3 Sectioned morphometric traits
4. Discussion
1. Introduction
Many species of fish undergo periods of natural starvation. The reasons include temperature declines associated with seasonal changes, spawning migration, and regional and seasonal decreases in food supply (Mustafa and Mittal 1982, Weatherley and Gill 1987, Lee et al. 1999). To survive periods of starvation, fish utilize biochemical, physiological, and behavioral strategies, in addition to reserved endogenous energy derived from metabolic accumulation (Mustafa and Mittal 1982, Weatherley and Gill 1987, Lee et al. 1999, Park et al. 2002, Hur et al. 2006a, Hur et al. 2006b, Park 2006, Park et al. 2007). However, this survival strategy can leave little energy available for other biological functions, including somatic growth. As a result, growth in body size slows considerably during starvation.
Although body shape in fish is largely determined by genetic factors (Riddell et al. 1981, Taylor and McPhail 1985), the use of morphometric analysis to discriminate among genetically discrete groups within a fish species is limited by the difficulty of measuring environmentally induced variations in body shape (Ihssen et al. 1981, Currens et al. 1989, Park et al. 2001a). Consequently, understanding how morphometric characteristics are affected by various feeding regimens will improve assessment of genetically discrete groups within the same species in habitats where food abundance and quality differ (Currens et al. 1989). Both truss and classical dimensions are used to describe fish body shape (Hubbs and Lagler 1947, Sträuss and Bookstein 1982). Truss dimensions, which include components of body depth and length along the longitudinal axis, have theoretical advantages over classical morphometric characters in discriminating among groups (Humphries et al. 1981, Sträuss and Bookstein 1982, Winans 1984, Currens et al. 1989). A variety of characteristics of the sectioned surface are critical elements in the marketing of fish because of consumer preferences with respect to the size and shape of the sectioned surface in gutted, sectioned, smoked, and non-gutted fish (Gjerde 1989, Gjerde and Schaeffer 1989, Park et al. 2002).
The cyprinid loach (Misgurnus anguillicaudatus) is a freshwater fish species in the loach family Cobitidae (Nelson 2006). The species is native to East Asia, but is also popular as an aquarium fish and has been introduced elsewhere in Asia and to Europe and North America. The cyprinid loach inhabits mud, ponds, and rice fields that are subjected to periodic drying, and this can result in starvation. The domestic market for the species has expanded rapidly in recent years, and consequently the cyprinid loach is now a commercially important freshwater species in Korea.
From a commercial perspective, traits including size, weight, and sectioned body parameters are important price-index indicators, as they control the market value of the fish (Gjerde 1989, Gjerde and Schaeffer 1989). Starvation is an important factor affecting the immune system, survival, and growth of the loach (Hur et al. 2006a, Hur et al. 2006b), and so can have a major impact on marketability factors. The main objective of this study was to determine the influence of feeding and starvation on the truss and classical dimensions, and the sectioned morphometric characteristics of cyprinid loach, and to gather data applicable to preventing starvation caused by environmental changes.
2. Materials and methods
2.1 Experimental fish
All procedures used in this study complied with current laws of Korea (Ordinance of Agriculture, Food and Fisheries, No. 1 and the law pertaining to experimental animals, No. 9932).
The specimens of M. anguillicaudatus (mean body weight ± SD: 7.4 ± 0.62 g; mean total length ± SD: 11.2 ± 0.78 cm) used in this experiment were hatched in October 2011 at the aquaculture facility at the Fishery Genetics and Breeding Science Laboratory of Korea Maritime and Ocean University, Busan, Korea. At the start of the experiment, two experimental groups were established: a fed and a starved group. For two weeks prior to the start of the experiment, all fish were fed daily with a commercial feed at a rate of 1%–3% of their total body weight. The fed group was hand-fed three times daily at 4 h intervals between successive feeds; the first feeding occurred between 08:00 and 12:00 h, the second between 12:00 and 16:00 h, and the third between 16:00 and 20:00 h. This commercial feed was also used in the experiment as the food for the fed group. During the experiment the fed group received food ad libitum, whereas the starved group was fasted.
The fish were reared in a recirculating water system comprising 1.1 ton fiberglass-reinforced circular tanks (118 cm diameter × 100 cm depth). Twenty fish were placed in each tank. Water temperature was controlled automatically at 25 ± 0.5°C during the experimental period, and the photoperiod was maintained at a 12:12 h light:dark cycle using an electric timer. Fish survival was recorded throughout the experiment. All experiments were continued until the fish in the starved group ceased activity. At the conclusion of the experiment, the fish were starved for 24 h before sampling, to ensure that at sampling the fish did not have guts distended by the presence of food (Park et al. 2001a, Hur et al. 2006a).
2.2 External morphometric trait analysis
Twenty fish were removed from the fed and starved groups for assessment of external morphometric traits. The fish were euthanized with an overdose of clove oil (Sigma; St Louis, MO, USA). As shown in Figs. 1 - 3 and Table 2, a total of 36 morphometric measurements, made to the nearest 0.1 mm using a digital vernier caliper (CD-20CP, Japan), were recorded for each freshly sampled individual. The external traits included the standard length (Ls; the most anterior extension of the head to the most posterior scale in the lateral line; 1×6; Fig. 3), and external morphometric traits for the head region including head length (HL), postorbital length (PL), snout length (SNL), eye diameter (ED), head width between the origin of the pectoral fins (HWOP), the direct distance between the anterior edge of the upper lip and the origin of the pectoral fins (DAUOP), the direct distance between the anterior edge of the upper lip and the eye (DAUE), and the direct distance between the anterior edge of the upper lip and the first nostril (DAUF) (Figs. 1 and 2).
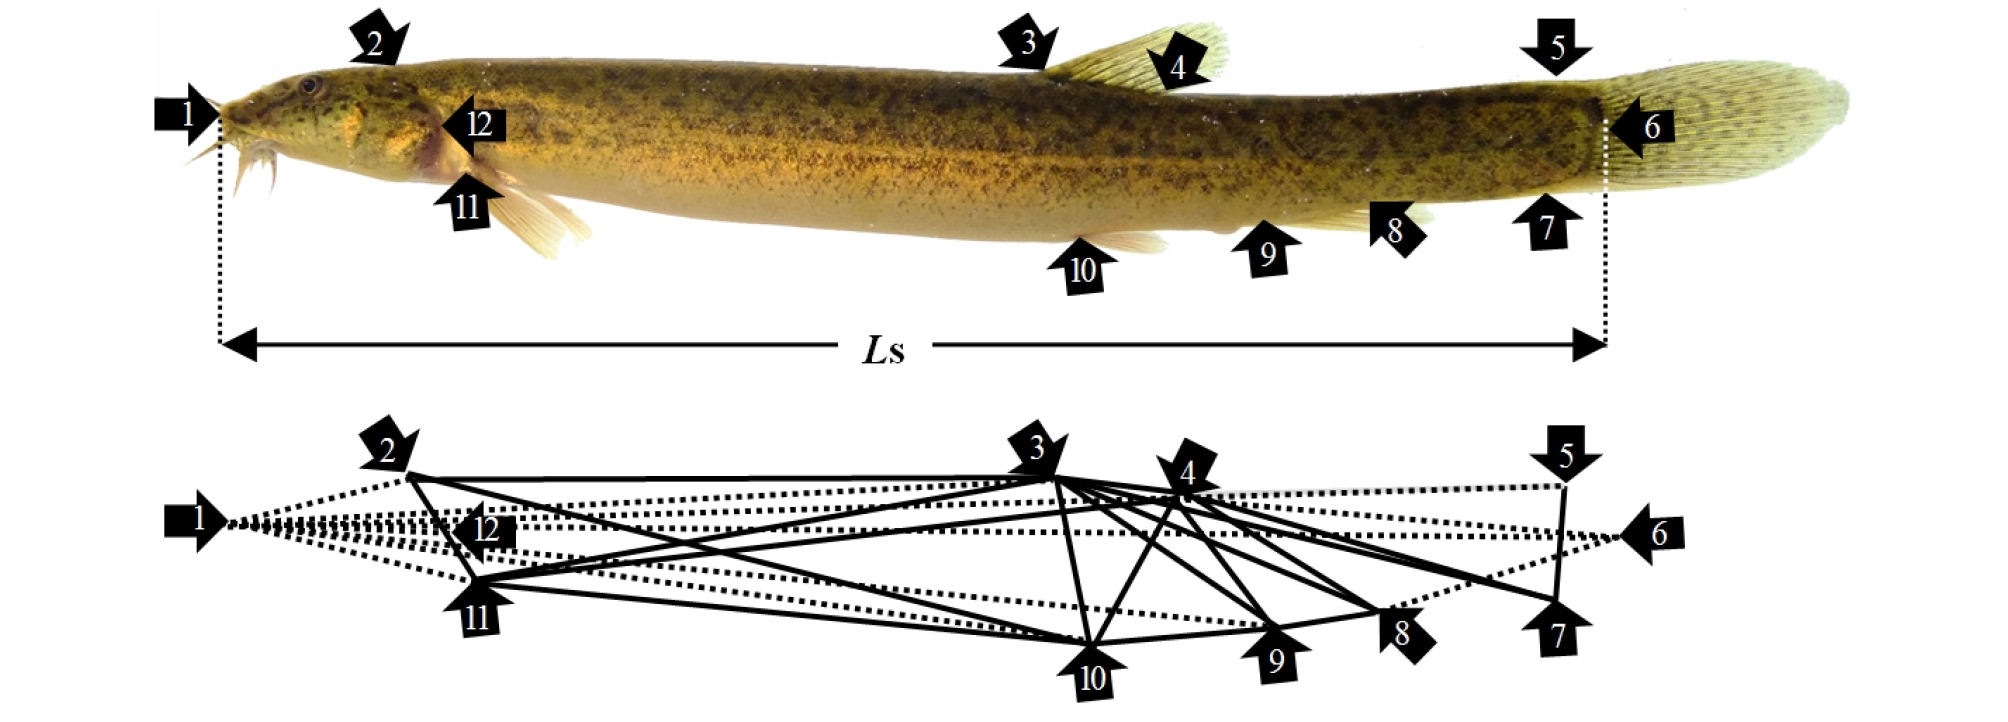
Fig. 1.
Truss and classical dimensions measured in this starvation experiment with the cyprinid loach, Misgurnus anguillicaudatus. Morphological landmarks are numbered and morphometric distances between the landmarks are shown. 1: most anterior extension of the head; 2: posterior end of supraoccipital; 3: origin of the dorsal fin; 4: insertion of the dorsal fin; 5: dorsal origin of the caudal fin; 6: most-posterior scale in the lateral line; 7: ventral origin of the caudal fin; 8: insertion of the anal fin; 9: origin of the anal fin; 10: origin of the pelvic fin; 11: origin of the pectoral fin; and 12: most-posterior aspect of the operculum. Ls: standard length. Black line: truss dimension; Black dotted line: classical dimension.
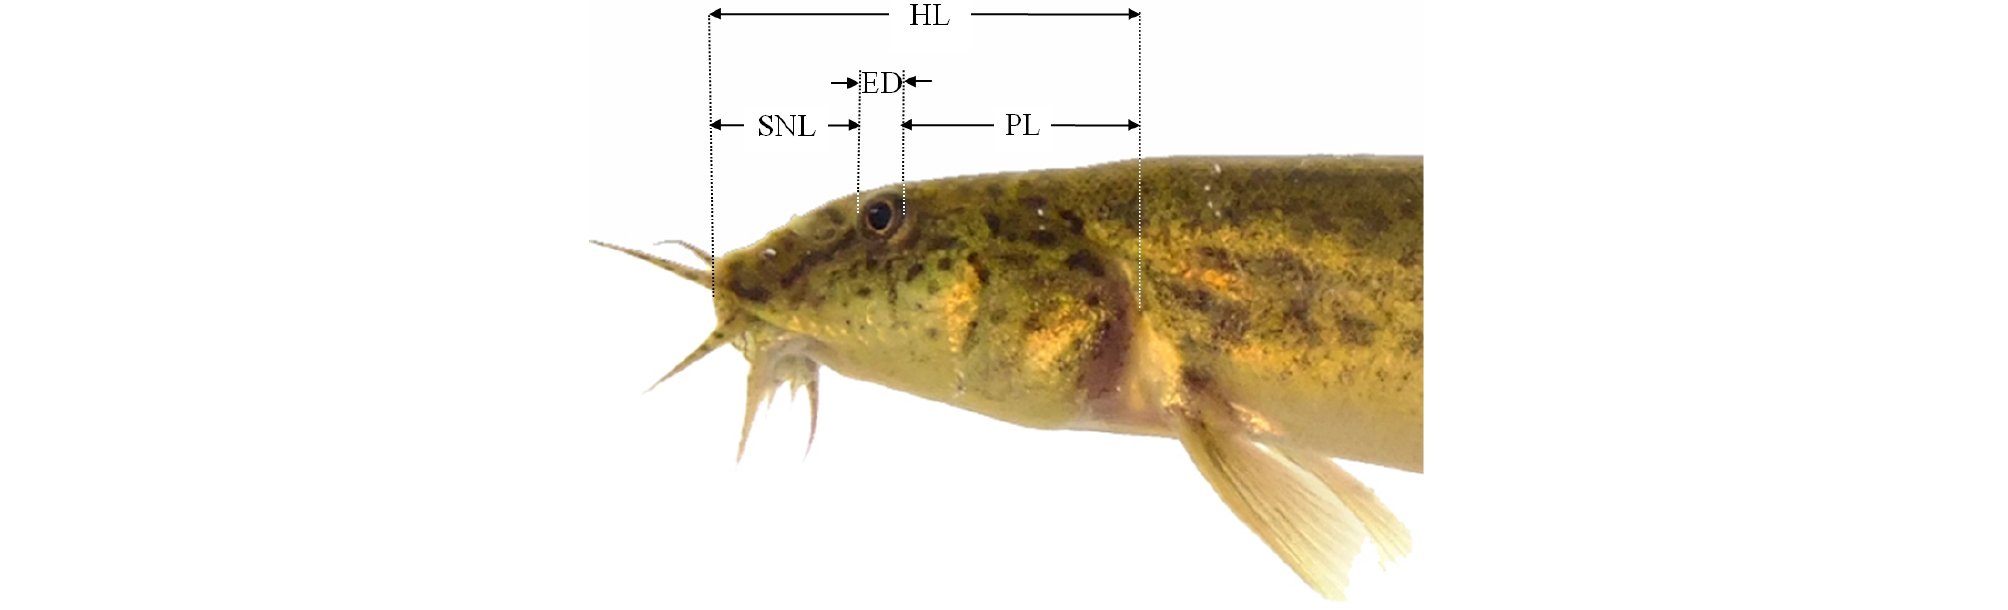
Fig. 2.
Horizontal distance for head dimensions measured in this starvation experiment with the cyprinid loach, Misgurnus anguillicaudatus. Head length (HL: from the most anterior extension of the head to the most posterior point of the operculum); postorbital length (PL: from the most posterior point of the eye to the most posterior point of the operculum); snout length (SNL: most anterior extension of the head to the most anterior point of the eye); and eye diameter (ED).

Fig. 3.
Direct distance for head dimensions measured in this starvation experimental with the cyprinid loach, Misgurnus anguillicaudatus. Head width between the origin of the pectoral fins (HWOP), direct distance between the anterior edge of the upper lip and origin of the pectoral fins (DAUOP), direct distance between the anterior edge of the upper lip and the eye (DAUE), and direct distance between the anterior edge of the upper lip and the first nostril (DAUF).
The measured external classical morphometric trait dimensions were: from the most anterior extension of the head to the posterior end of the supra-occipital (1×2); the most anterior extension of the head to the origin of the dorsal fin (1×3); the most anterior extension of the head to the insertion of the dorsal fin (1×4); the most anterior extension of the head to the dorsal origin of the caudal fin (1×5); the most anterior extension of the head to the origin of the anal fin (1×9); the most anterior extension of the head to the origin of the pelvic fin (1×10); the most anterior extension of the head to the origin of the pectoral fin (1×11); the most anterior extension of the head to the most posterior aspect of the operculum (1×12); and the insertion point of the dorsal fin to the most posterior scale in the lateral line (4×6).
The measured external truss morphometric trait dimensions were: the posterior end of supra-occipital to the origin of the dorsal fin (2×3); the posterior end of the supra-occipital to the origin of the pelvic fin (2×10); the posterior end of the supra-occipital to the origin of the pectoral fin (2×11); the origin of the dorsal fin to the point of insertion of the dorsal fin (3×4); the origin of the dorsal fin to the ventral origin of the caudal fin (3×7); the origin of the dorsal fin to the insertion of the anal fin (3×8); the origin of the dorsal fin to the origin of the anal fin (3×9); the origin of the dorsal fin to the origin of the pelvic fin (3×10); the origin of the dorsal fin to the origin of the pectoral fin (3×11); the point of insertion of the dorsal fin to the ventral origin of the caudal fin (4×7); the point of insertion of the dorsal fin to the point of insertion of the anal fin (4×8); the point of insertion of the dorsal fin to the origin of the anal fin (4×9); the point of insertion of the dorsal fin to the origin of the pelvic fin (4×10); the point of insertion of the dorsal fin to the origin of the pectoral fin (4×11); the dorsal origin of the caudal fin to the ventral origin of the caudal fin (5×7); the point of insertion of the anal fin to the origin of the anal fin (8×9); the origin of the anal fin to the origin of the pelvic fin (9×10); and the origin of the pelvic fin to the origin of the pectoral fin (10×11) (Fig. 3 and Table 1). The external morphometric trait measurements for the head region were recorded from the same fish used for measurement of the 36 morphometric traits. Each external morphometric trait was analyzed relative to the Ls or HL.
Table 1. Dimension of body shape used in this study*
2.3 Sectioned morphometric trait analysis
Twenty fish were removed from the fed and starved groups for measurement of the sectioned body morphometric traits. The standard length of each fish was measured to the nearest 0.1 mm using a digital vernier caliper and an opisometer (Curvimeter, Japan). The fish were euthanized with an overdose of clove oil, and dorso-ventrally sectioned posterior to the base of the pectoral fin (P), anterior to the base of the dorsal fin (A), and anterior to the base of the anal fin (D) (Fig. 4).

Fig. 4.
Total height (THX), width (WX), area (AX), height (HX), and belly thickness (BTX1, BTX2) measured in cyprinid loach, Misgurnus anguillicaudatus on a cross section slice (lower Figure) taken just posterior to the base of the pectoral fin (X=P), just anterior to the base of the dorsal fin (X=A) and just anterior to the base of the anal fin (X=D)(upper Figure).
The sectioned morphometric traits measured were: the body circumference posterior to the base of the pectoral fin (CIP), anterior to the base of the dorsal fin (CIA), and anterior to the base of the anal fin (CID); the area posterior to the base of the pectoral fin (AP), anterior to the base of the dorsal fin (AA), and anterior to the base of the anal fin (AD); the total height posterior to the base of the pectoral fin (THP), anterior to the base of the dorsal fin (THA), and anterior to the base of the anal fin (THD); the width posterior to the base of the pectoral fin (WP), anterior to the base of the dorsal fin (WA), and anterior to the base of the anal fin (WD); the height posterior to the base of the pectoral fin (HP) and anterior to the base of the dorsal fin (HA); the belly thickness at two points posterior to the base of the pectoral fin (BTP 1 and BTP 2); the belly thickness at two points anterior to the base of the dorsal fin (BTA 1 and BTA 2); average belly thickness (ABT); the body shape (BS); and the section shape (SS) (Fig. 4).
2.4 Statistical analysis
The experiment was performed in triplicate and the results are reported as means ± SD (n = 20), unless otherwise stated. The data were analyzed by one-way ANOVA using the SPSS statistical package (SPSS 9.0, SPSS Inc., Chicago, IL, USA). Means were compared using Duncan’s multiple range test, and were considered significantly different at P<0.05.
3. Results
3.1 Growth and survival
The starved group rapidly lost vitality, so the experiment was terminated when all fish in starved group ceased activity. The cumulative survival was 87 ± 1.2% in the fed group and 40 ± 2.4% in the starved group in each of the triplicate tanks. At the start of the experiment, the average Ls and body weight were 10.4 ± 0.39 cm and 6.2 ± 0.29 g, respectively, in both groups. After 4 weeks, Ls and body weight of the cyprinid loach in the fed group were 12.7± 1.49 cm and 9.6 ± 1.00 g, respectively, and in the starved group were 11.9 ± 0.93 cm and 5.7 ± 0.54 g, respectively.
3.2 External morphometric traits
Table 2 shows the measurement results for external morphological features for the head region of the fed and starved groups. The values of the dimensions HL, SNL, PL, and HWOP were higher for the fed group than the starved group (P<0.05). There were no differences in the measured dimensions ED, DAUOP, DAUE, and DAUF between the two groups (P>0.05).
Table 2. Truss dimensions of the cyprinid loach, Misgurnus anguillicaudatus, in the initial, fed, and starved group treated for this 30 days starvation experiment*
Tables 3 and 4 show the measurements for the external morphometric traits for the fed and starved groups. Compared with the initial group there were significant differences in the truss dimensions of the fed and starved groups. For the fed group the dimensions 2×3, 2×10, 2×11, 3×4, 3×7–11, 4×7–11, 5×7, 9×10, and 10×11 increased, and no dimension decreased (Pɚ0.05). For the starved group the dimensions 2×3, 2×10, 2×11, 3×4, 3×7, 3×11, 4×7, 4×8, 4×11, and 5×7 increased, and the dimension 4×9 decreased (P>0.05). There were no significant differences in the truss dimensions 4×10 and 8×9 among all groups.
Table 3. Classical dimensions of the cyprinid loach, Misgurnus anguillicaudatus, in the initial, fed, and starved group treated for this 30 days starvation experiment*
Table 4. Means for phenotypic trait of the cyprinid loach, Misgurnus anguillicaudatus, treated for this 30 days starvation experiment*
There were significant differences in the classical dimensions of the fed group and the starved group compared with the initial group. For the fed group the dimensions 1×2–6, 1×9–11, and 4×6 increased, and no dimension decreased (P<0.05). For the starved group the dimensions 1×2–6, 1×9–11, and 4×6 increased, and no dimension decreased (P<0.05).
3.3 Sectioned morphometric traits
Table 5 shows the measurement results for the sectioned morphometric traits for the fed and starved groups. The Ls was significantly greater (P<0.05) for the fed group than either the initial group (a factor of 1.22 greater) or the starved group (a factor of 1.10 greater). The values for body circumference, section area, section height, and section width were significantly higher (P<0.05) for the fed group than either the initial or the starved group (Table 5). The A and D line region in fish in the starved group exhibited significant changes in terms of body circumference, sectioned width and sectioned area, compared with the P line region (Figs. 5 and 6). The trunk appeared to be the major region affected by changes resulting from the different dietary conditions. The values for BTP 1, BTP 2 and ABT (related to the abdominal cavity thickness) were higher in the fed group than in the starved group (Table 5) (P<0.05).
Table 5. Means for phenotypic trait of the cyprinid loach, Misgurnus anguillicaudatus, treated for this 30 days starvation experiment*
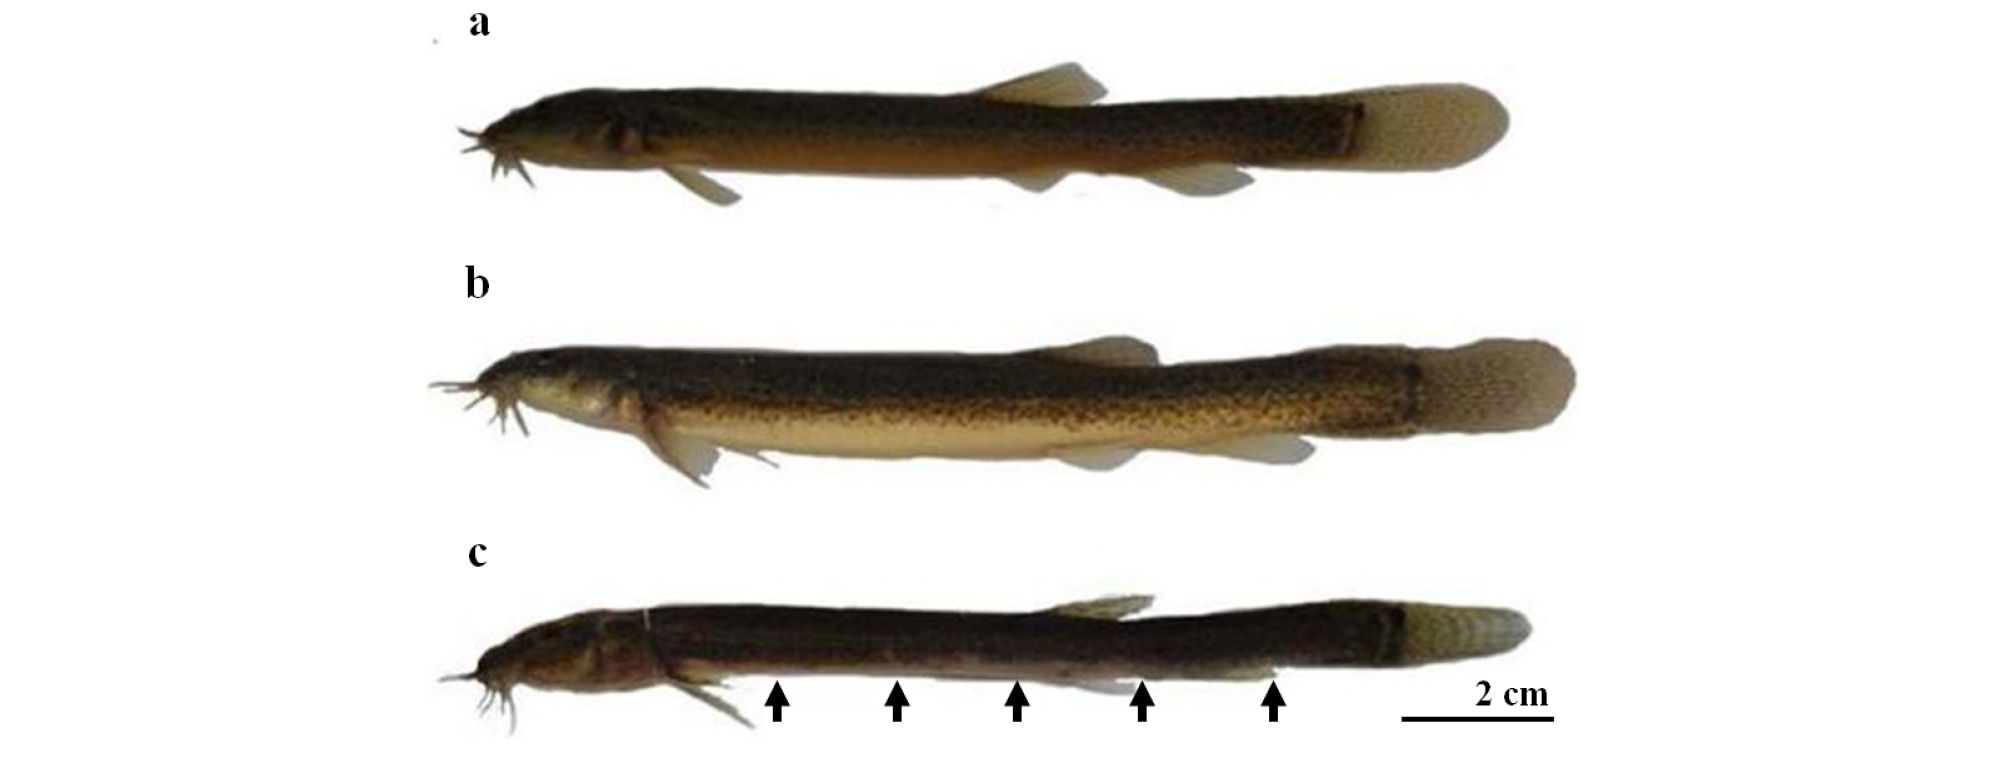
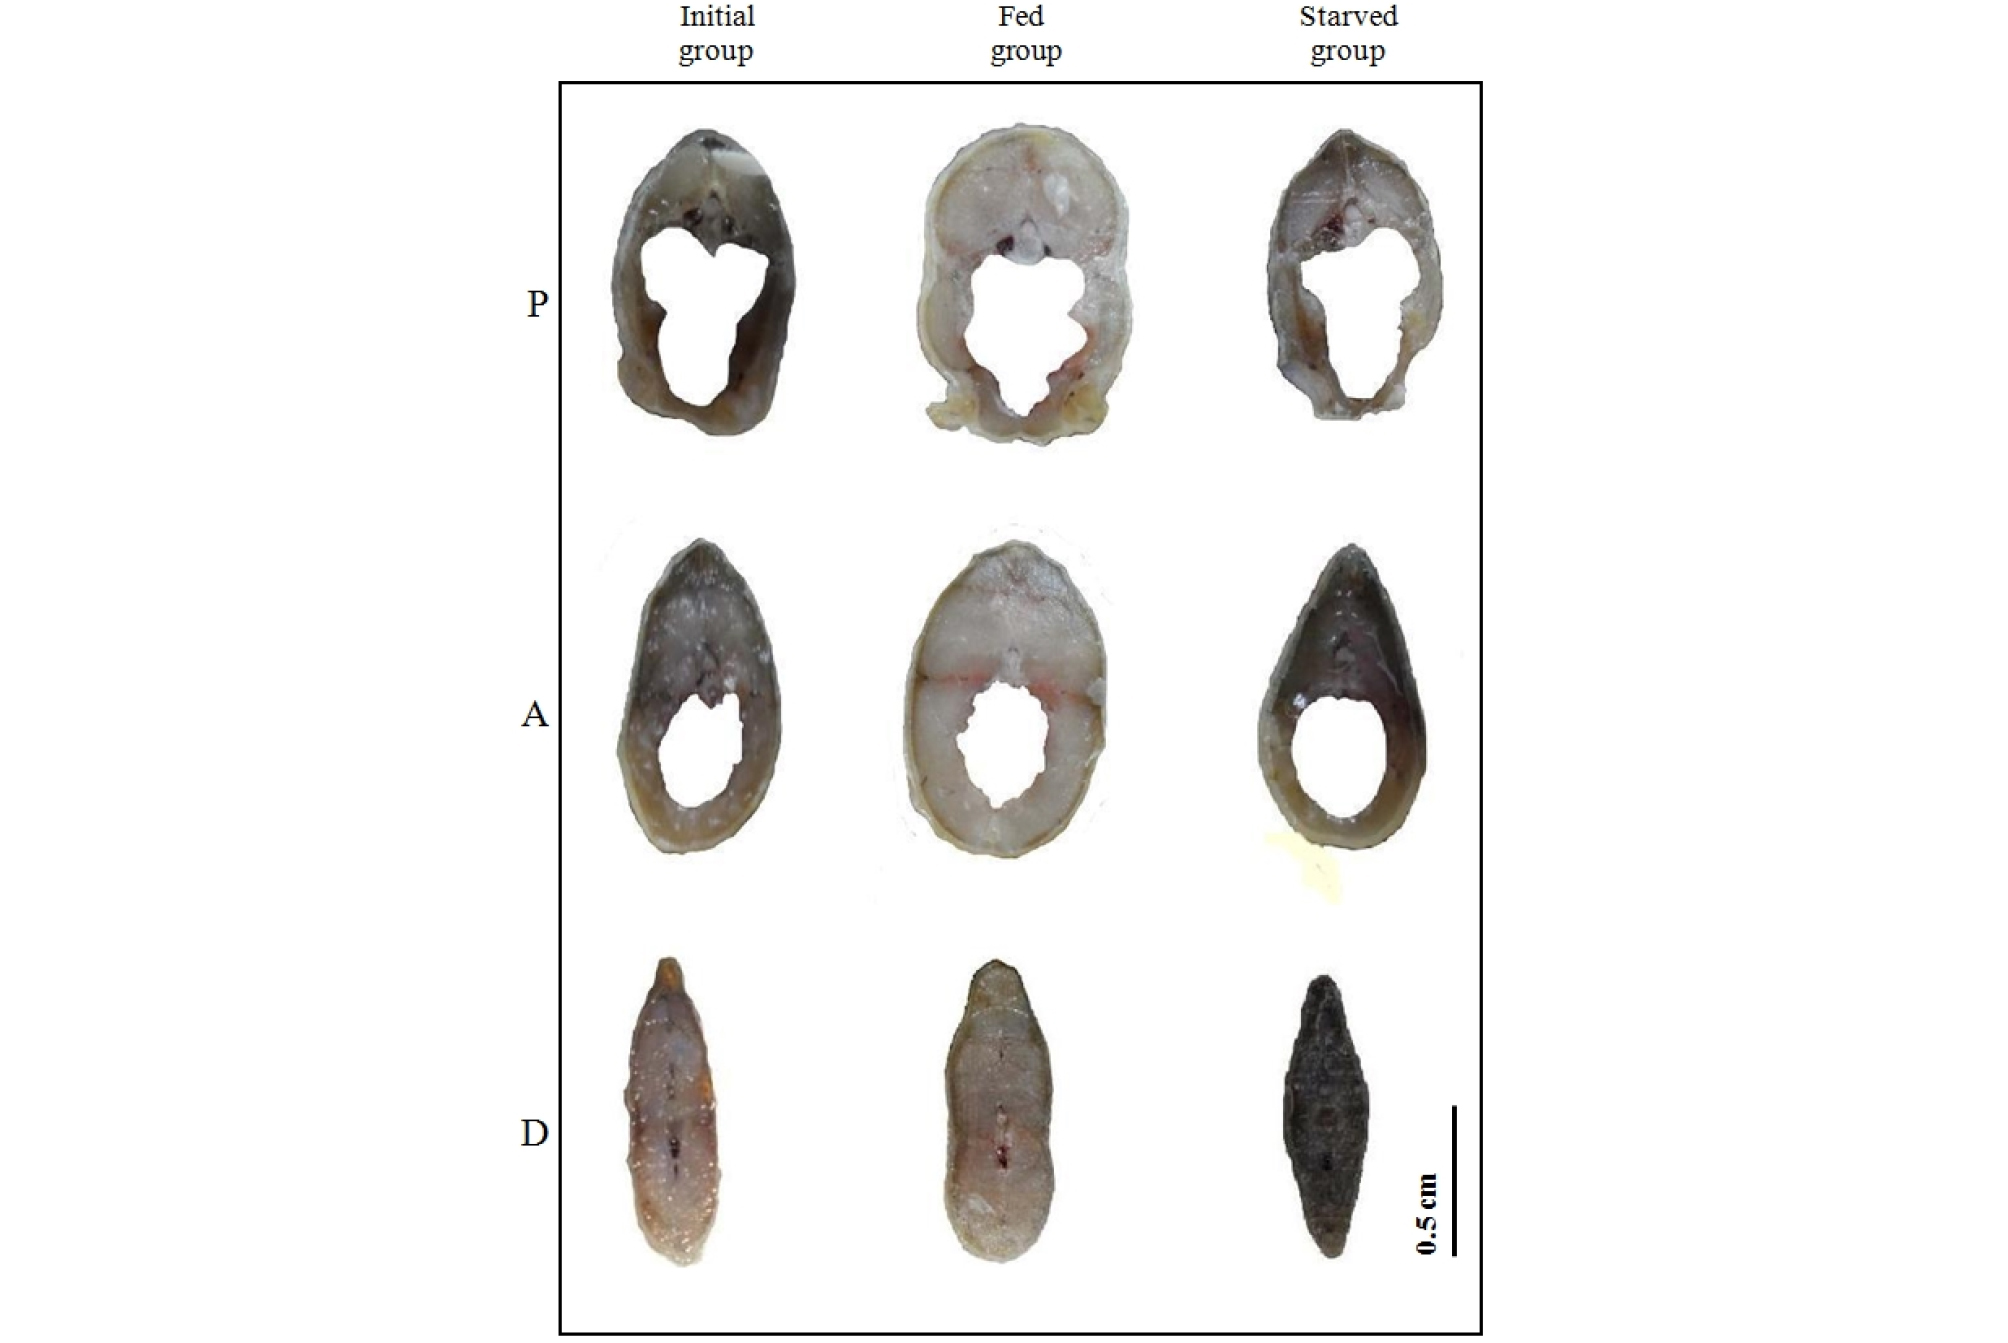
Fig. 6.
Typical external morphology of a cross section slice taken from this starvation experiment in cyprinid loach, Misgurnus anguillicaudatus, which finished starvation experiment at one-third line between most posterior aspect of operculum and mediate point of standard length (P), a vertical line which intersect at right angle of the intermediate point of standard length (A) and midpoint line between mediate point of standard length and most posterior scale in lateral line (D).
Table 6 shows that the SS 1-1, SS 1-2, and SS 2-1 dimensions among the sectioned morphometric traits were dependent on body width and body height. The value of SS 2-1 was significantly higher for the starved group relative to the fed and initial groups (P<0.05), while the values of SS 3-1 and SS 3-3 were higher for the starved group relative to the fed group (P<0.05).
Table 6. Means for phenotypic trait of the cyprinid loach, Misgurnus anguillicaudatus, treated for this 30 days starvation experiment*
4. Discussion
Fish respond to starvation through the use of accumulated energy stores (Love 1970). Fish require a base level of energy to maintain metabolism, and storage products in the body provide most of this energy. Studies of starvation have provided basic information on the nutritional requirements and growth in wild and cultivated fish (Weatherley and Gill 1987, Lee et al. 1999, Park et al. 2001a). During starvation, essential processes are maintained at the expense of accumulated (i.e. completely endogenous) energy reserves, resulting in the progressive depletion and wastage (degrowth) of body tissues (Weatherley and Gill 1987).
Morphological differences among individuals can be caused by both genetic and environmental factors, and genetic–environment interactions (Li et al. 1993). However, some research indicates relatively low heritability of morphometric parameters, suggesting that environmental factors (e.g. nutritional condition) have a dominant role in determining morphological differences. At completion of the 4-week experimental period the average total length and body weight of M. anguillicaudatus increased in the fed group, but decreased in fish in the starved group (P<0.05). This is a similar result to that reported by Sumpter et al. (1991) during a 4-week starvation experiment involving rainbow trout (Oncorhynchus mykiss). We found that the dimensions HWOP, HL, SNL, and PL in the fed group were greater than in the starved group, while for the dimensions ED, DAUOP, DAUE, and DAUF there were no significant differences between the fed and starved groups. These results suggest that the latter parameters are not affected by food availability or quality.
Truss and classical dimensions are the morphometric characteristics used for assessing body shape in fish (Park et al. 2001b). In this study we used both truss and classical dimensions to measure Ls and HL. We found that at the end of the 4-week experiment the head and body truss dimensions were significantly greater in the fed and starved groups relative to the initial group. Similar results were found by Park (2004), who reported significant increases in the head and body truss dimensions in each of a fed group and a starved group of Chinese minnow (Rhynchocypris oxycephalus), following a starvation period of 75 days. In contrast, we found that the 8th truss dimension (the dimension from the point of insertion of the anal fin to the origin of the anal fin) did not change in either the fed group or the starved group during the experiment. This suggests that the dimensions of the body parts involved are less affected by food availability or quality, and thus may be useful as taxonomic indicators to discriminate among species of cyprinid loach. Previous studies have used dimensions of the caudal region, and other truss and classical dimensions, as taxonomic indicators for salmonid fry and Chinese minnow, respectively (Currens et al. 1989, Park et al. 2001a). In cyprinid loach, the value of the trunk region dimensions, including a large component of body depth, is likely to be compromised by variability related to differences in the feeding regimes of fish in different habitats.
With respect to the cross-sections of the body, greater changes occurred in body cavity regions A and D than in region O (Table 5). These results indicate that phenotypic variation in the dorsal fin in relation to the body cavity region occurred first, and this was followed by phenotypic variation in the pectoral fin. Lee et al. (1999) also reported that the primary impact of starvation in Chinese minnow was on the body cavity region. Park et al. (2001a) reported a significant decrease in the upper body and body depth dimensions of Chinese minnow under starvation conditions. In relation to the body cavity thickness 1 (BTP 1 and BTA 1), body cavity thickness 2 (BTP 2 and BTA 2), ABT, BTA 1, BTA 2, BTP 1, BTP 2 and ABT for the fed group were thicker than for the starved group (Table 5). This suggests that during starvation the fish used energy derived from tissues associated with body cavity wall. In addition, the ABT level in the fed group was significantly higher than in the starved group, indicating that in consideration of breeding goal for increasing body cavity thickness of the individuals, this may be used for commercial means as the marketability of the starved fish is lower than that of fed fish (Gjerde and Schaeffer 1989).
The cross-sectional shapes SS1-1, SS1-2, and SS 2-1 did not differ significantly between the fed and starved groups (Table 6) (P>0.05), indicating that starvation did not affect the cross-sectional dimensions at 1-1, 1-2, and 2-1. However the cross-sectional dimension SS 3-1 was larger in the fed group than in the starved group (P<0.05) (Table 6), indicating that the cross-section of the fed group was more circular than the starved group (Gjerde 1989). Thus, cross-sectional dimensions as a measure of circular shape may be a useful phenotypic trait because of its relationship to marketability.
Our results provide information about the changes to external and sectioned morphometric traits under starvation conditions. The data derived from this study of cyprinid loach under starvation conditions provide a basic guide for the regulation and scheduling of feeding, and as indices of the nutritional status of cyprinid loach.
